Despite the Civil Rights Act of 1964, which spearheaded policies like the National Environmental Policy Act to prevent communities from being under poor infrastructure projects, there has been little accountability over highway widening projects driven by manipulated vehicle-per-day projections. Despite “nationally, the United States spends nearly $150 billion per year on road and highway construction” as both Benjamin Ross and Joseph Cortright discussed in Dissent Magazine’s Highway Robbery, there is virtually no recourse to stop corrupted projects from being built.
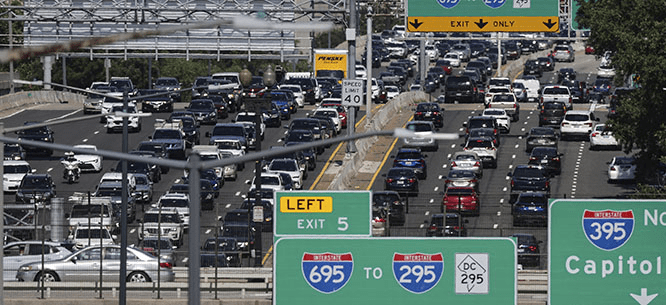
From: Dissent Magazine, Highway Robbery, “Traffic on I-395 in Washington, D.C. (Kevin Dietsch/Getty Images)”
Let us step back to put $150 billion in perspective. Tampa’s annual operating budget is roughly $2 billion to run a city of 400,000 people on 175 square miles of water and land. This means annually, this $150 billion figure can serve seventy-five Tampa-sized cities or at least sixteen Hillsborough County-sized areas (Tampa is in Hillsborough County) of over 1.4 million people and a boundary of 1,266 square miles!
It seems harmless for a government to invest in infrastructure while accepting oversight from both federal and state transportation agencies to manage forecast methods of traffic demand. But what if the forecast models are engineered to be so complex they cannot be understood? Or in some cases, to be physically obtained? What if the federal government or planning agencies make a mistake or purposely nudge results of forecasting traffic data to build a wider highway regardless if the public needs it or not? Imagine if some of these issues with traffic projections are discovered three or more decades later on an unbuild project, yet that project gets built?!
So where does traffic forecasting come from?
“The National Environmental Policy Act, passed in 1970, requires highway builders to assess environmental impacts before an interstate highway can be built or expanded. These assessments hinge directly on estimates of future traffic levels. The forecasters, usually employees or consultants for the state highway agency, use models developed by regional planning organizations. Established by federal law in each metropolitan area, the regional planners are theoretically independent of the highway agencies, but in practice are usually under their thumb.”
With Tampa, this “under the thumb” mentality was observed during transportation public hearings in Hillsborough County. Many local transportation advocates heard our state DOT threatened to take funding away from our district if the massive Tampa Bay Express (TBX) highway widening project didn’t get adopted as a priority project. This was echoed from nearly all legacy economic groups (chambers to economic partnerships) who attended these hearings. Many of these groups appear to have been cordoned off by FDOT to ensure economic acceptance of this project. Formally, these same economic groups are included under a Environmental Impact Statement (EIS) study by NEPA which would determine if project like TBX were to get built. However, nearly all those individuals who were part of these groups, much like the governing board the TPO, did not reside in the areas of impact within the proposed project. Even properties in the proposed impact areas were being preemptively purchased before the EIS or in short, TBX was determined and accepted to be constructed!
A bad forecast between Portland and Vancouver, Washington.
Like TBX, which arouse from Master Plan by DOT in 1984, Oregon and Washington State Departments of Transportation or WSDOT, was pushing their own zombie highway expansion on I-5 Columbia River Bridge (CRB).
Because the proposed project is 20 years old, traffic projections of today were grossly inflated. Concerned over the discrepancy of traffic modeling with a no-build scenario, Joseph Cortright through a public record request, discovered “project consultants had systematically altered numbers to favor the proposed project and minimize environmental impacts. These changes made “no-build” traffic volumes look larger, and congestion vastly worse, than the model had predicted.” He alarmingly discovered WSDOT’s claim under a no-build scenario that traffic would “grow 1.3 percent per year for the next two decades.” Cortright discovered that “traffic growth from 2005 to 2019 averaged just 0.3 percent per year.”
WSDOT claimed post-processing was the reason for this discrepancy. This later exercise (again, this is a twenty year old project) from WSDOT “include graphing, interpolation, unit conversion, or smoothing to remove numerical noise. But crucially, genuine post-processing does not alter the findings of the simulation model.”
This all means this is an aesthetic application to pitch data to the public at-large. Similar to seeing a simple diagram like below if nothing was done or what DOTs commonly refer to as a ‘no-build’ scenario. Sure, diagrams like this look clear and succinct, but how do we know this will become reality to warrant a multi-billion dollar project?
Under the thumb in Maryland.
The Maryland Toll Lane Project was pitched by Governor Larry Hogan in 2017. Originally the project was to “widen nearly 100 miles of highways around Washington, D.C., by adding privatized toll lanes.” The contested project was revised multiple times and shrunk by 2021. However, like WSDOT’s project relating to the no-build scenario, MDOT’s show an unexplainable increase by “as much as 10 percent, from the traffic predicted by the same model in the previous report.” It was later learned, after a two year effort under the Public Information Act, MDOT “had attributed two different sets of numbers to the same model run.” There were other wild discrepancies found in MDOTs traffic volume models the claimed “widening highways west of Washington would substantially reduce traffic toward Baltimore and Annapolis on the northeast side of the city.” While these discrepancies eventually got fixed under another revised study, traffic volume once again changed.
Just three weeks before federal approval of MDOT’s toll lanes, Benjamin Ross and other advocates who discovered these errors (and forced prior revisions) elevated their concerns and “requested an investigation into possible scientific fraud, attracting media attention.” The approval was stalled and one month later, The Volpe Center, a federal transportation research organization acting as 3rd party, “responded, saying that while manual adjustments to model outputs are sometimes necessary, the Maryland modelers had not explained their adjustments and therefore Volpe could not “assess their plausibility or validity.”
Governor Hogan, who had hoped to put the toll lanes at the center of a possible presidential campaign, was furious at the delay. Calling it “outrageous and shocking,” he wrote to President Joe Biden to demand immediate action, and threatened a lawsuit if it wereforthcoming.
Under the thumb, Federal approval came on August 25. The Maryland DOT press release announcing the decision blatantly misrepresented the Volpe Center’s findings: “USDOT Independent Review Finds No ‘Scientific Fraud’ in Toll Lane Traffic Model,” the headline declared.
Deep within approving documents, “Maryland DOT admitted to the public for the first time that it had manually changed traffic model outputs.”
Finally, some engineers are calling out DOT falsehoods.
Traffic modeling since NEPA passed over 50 years ago has remained elusive in public understanding and untrustworthy from the top-down public agencies. For example, “Researcher Tony Dutzik reviewed two decades of predictions of automobile usage by state transportation departments, the Federal Highway Administration, and industry groups. In nearly every case, Dutzik found, actual traffic volumes grew substantially more slowly than forecaster.” Another traffic engineer, Norm Marshall, “find highway agencies ignoring real growth trends and capacity constraints to overstate projected traffic congestion. The predicted no-build congestion is exaggerated; the environmental damage from the added traffic that the wider road will attract is minimized. Building these unrealistic assumptions into traffic models serves the interests of highway builders.”
Has both the Federal Government and State DOT standardized malpractice in multiple states? It would seem apparent as [traffic] “modelers from seven states told the advocacy group Transportation for America that their organizations alter outputs manually based on “engineering judgment” or “long-range trends” as part of their post-processing. Similar reports come from former employees of highway agencies elsewhere.”
An attempt to explain why current modeling to forecast traffic is bad and why it is unnecessarily complicated.
Here is a bullet list of our take along with Ross’ and Cortright’s interpretations:
- People who follow transportation may be familiar with TAZ or Traffic Analysis Zones. TAZ geometrically breaks up regions to quantify “residents in each zone and the locations of their jobs, both currently and as predicted for a “forecast year” twenty or thirty years in the future.” From that region, the best commute is established, including “non-commuting trips, like those for shopping, trucking, and through travel by long-distance drivers, are added in as well.” While this may simplify metropolitan areas, not everyone is static. It is reasonable to assume people will move, die or cannot travel as much in thirty years. Also, “traffic is not divided accurately among nearby roads. The user’s guide for at least one regional model even warns against using it to predict traffic on individual roads, before going on to say that it will be used in just that way.” In plain-speak, traffic does not vanish from one zone to the next. The same commuters cross county lines every day, cut through another’s city everyday if their own county lacks jobs or particular services we see so often with endless growth of exurbia.
- Ignoring Latent Demand. Induced demand is a symptom of Latent Demand. In the transportation world, Induced Demand is referred to creating more lanes/capacity or creating demand to be used by traffic-more cars. But where does this traffic come from, especially months after a project is completed? “If a highway is widened to speed up traffic, the missing traffic will return, and job and home relocations will create new traffic. The models in current use are unable to count the drivers waiting in the wings, let alone predict how the number of cars on the road will vary as congestion gets better or worse. As a result, the models often fail when trying to analyze congested roadways.”
- Today’s models are inflexible to the public and do not account for ideal changes in land use and overall public needs (housing), economic trends (recessions or economic sequesters), natural disasters, environmental justice or restorative goals, or ‘gray swans.’ However, these models are extremely flexible within State and Federal DOT agencies. “With these weaknesses, models tend to depart from reality even when used with the best intentions. When they fail even to reproduce current traffic conditions, as often happens, modelers introduce fudge factors to create a match, which in turn makes them less sensitive to future changes. Algorithms pushed far outside their realm of applicability spew out nonsense.” As discussed, post-processing can cover up data manipulation, selling a multibillion-dollar highway widening project on a high level with virtually no science available to fact-check it.
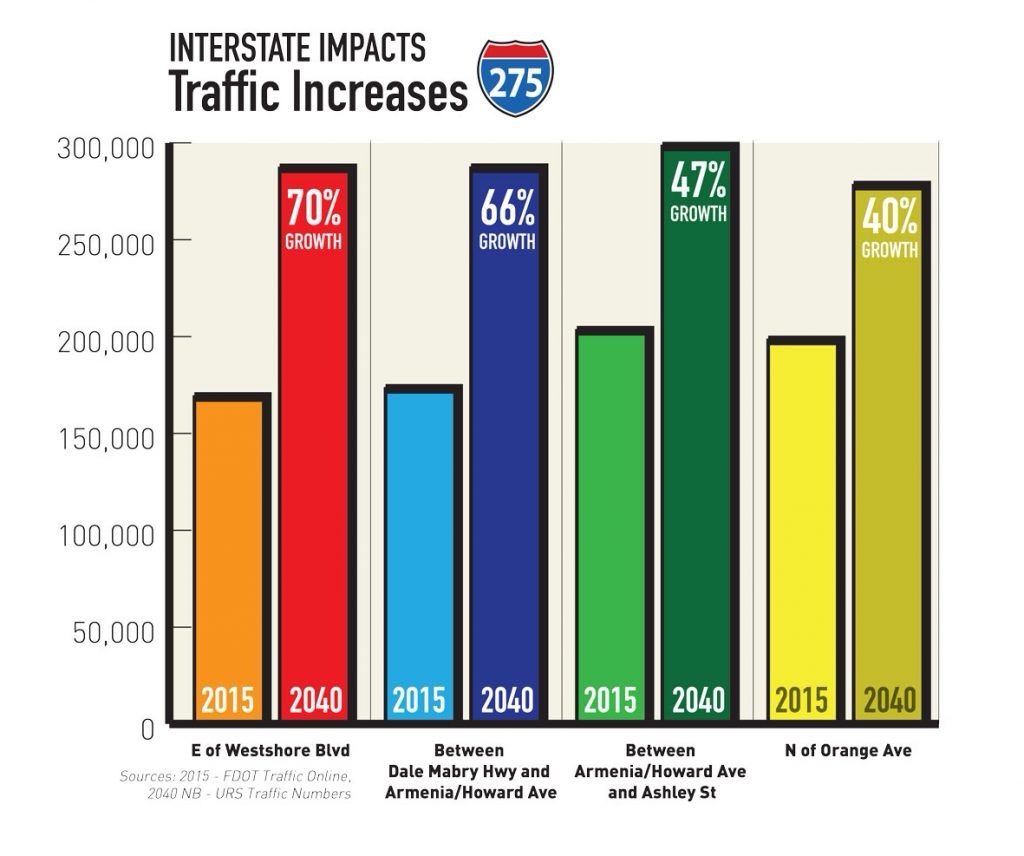
Here is are some examples locally in Tampa Bay of poor forecasting.
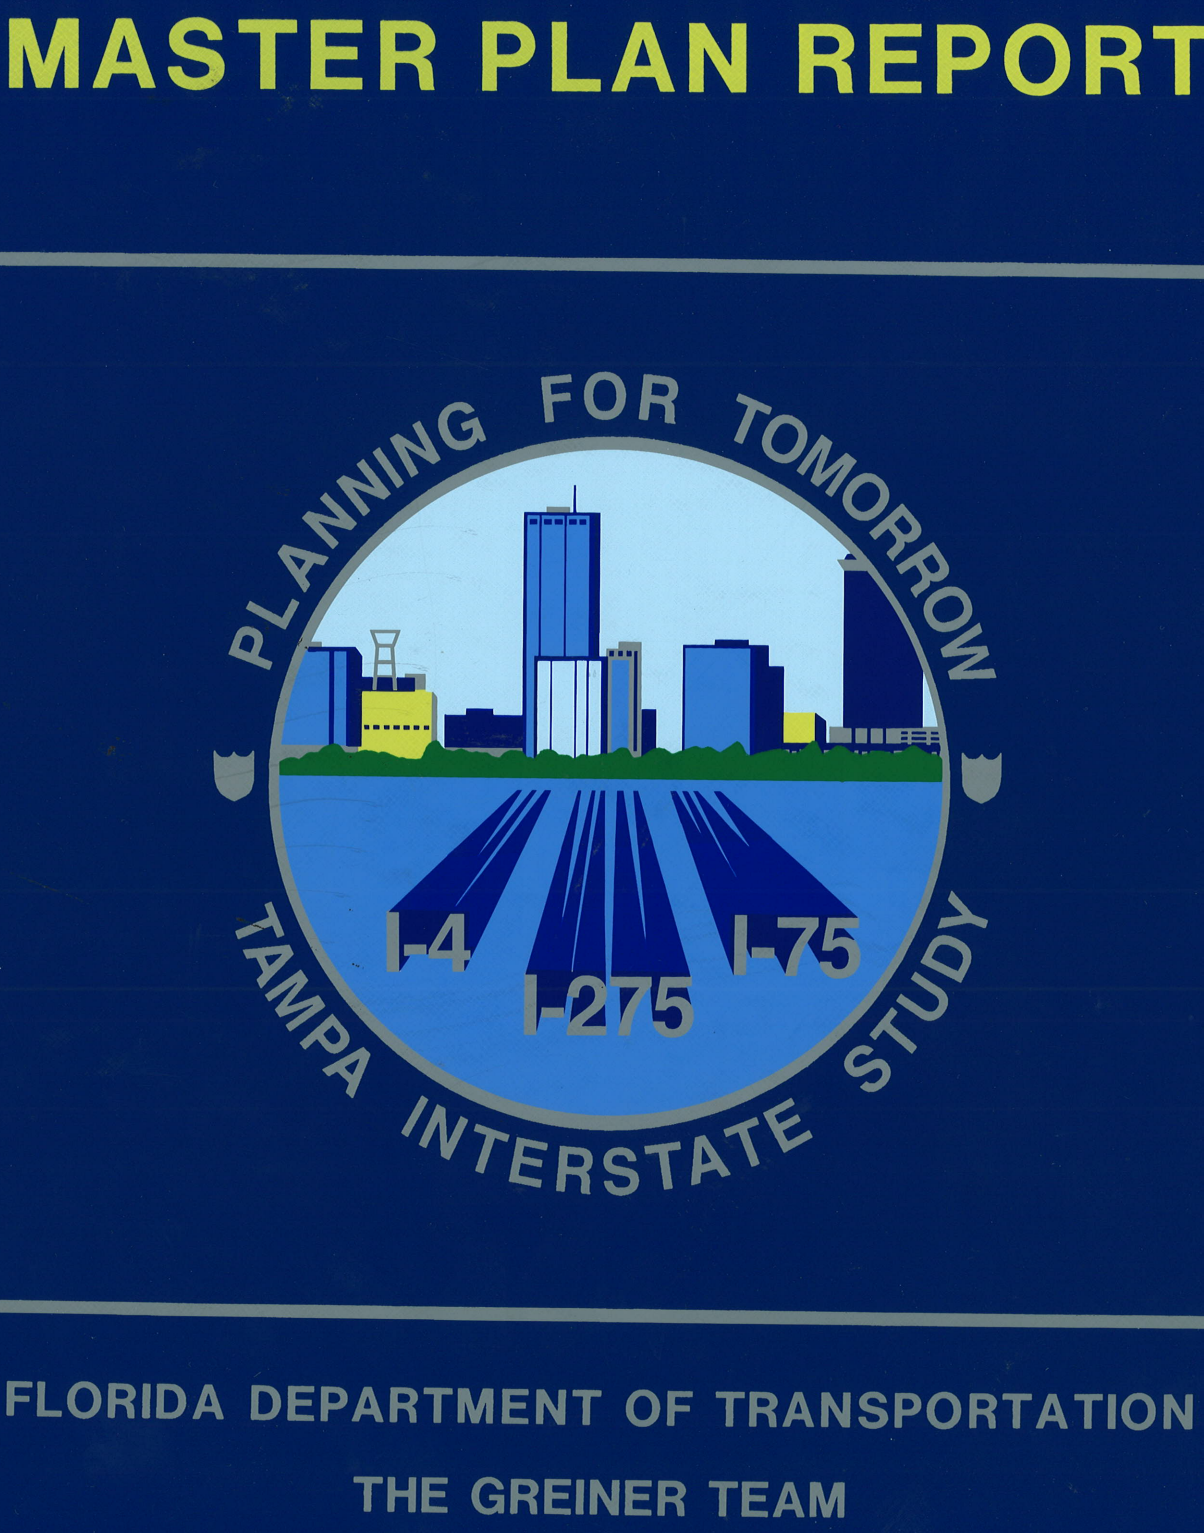
Mentioned earlier, Tampa’s highway widening project TBX, which is currently being built as TBNEXT, rose from an earlier study that was completed in 1996. A history of all studies (thousands of pages) related to this project at located an FDOT’s Tampa Bay Next site. This EIS was completed in 1996. The project was conceptually started in 1984, which ended with a series of ‘Master Plan’ drawings completed in 1989. Below is the cover of the nearly 600 pages of drawings assuming FDOT got its ROW. FDOT got their land through preemptive real estate purchases before the feds allowed them to build this project. Just recently, FDOT finish acquiring all the land needed to build this project despite being 41 years old.
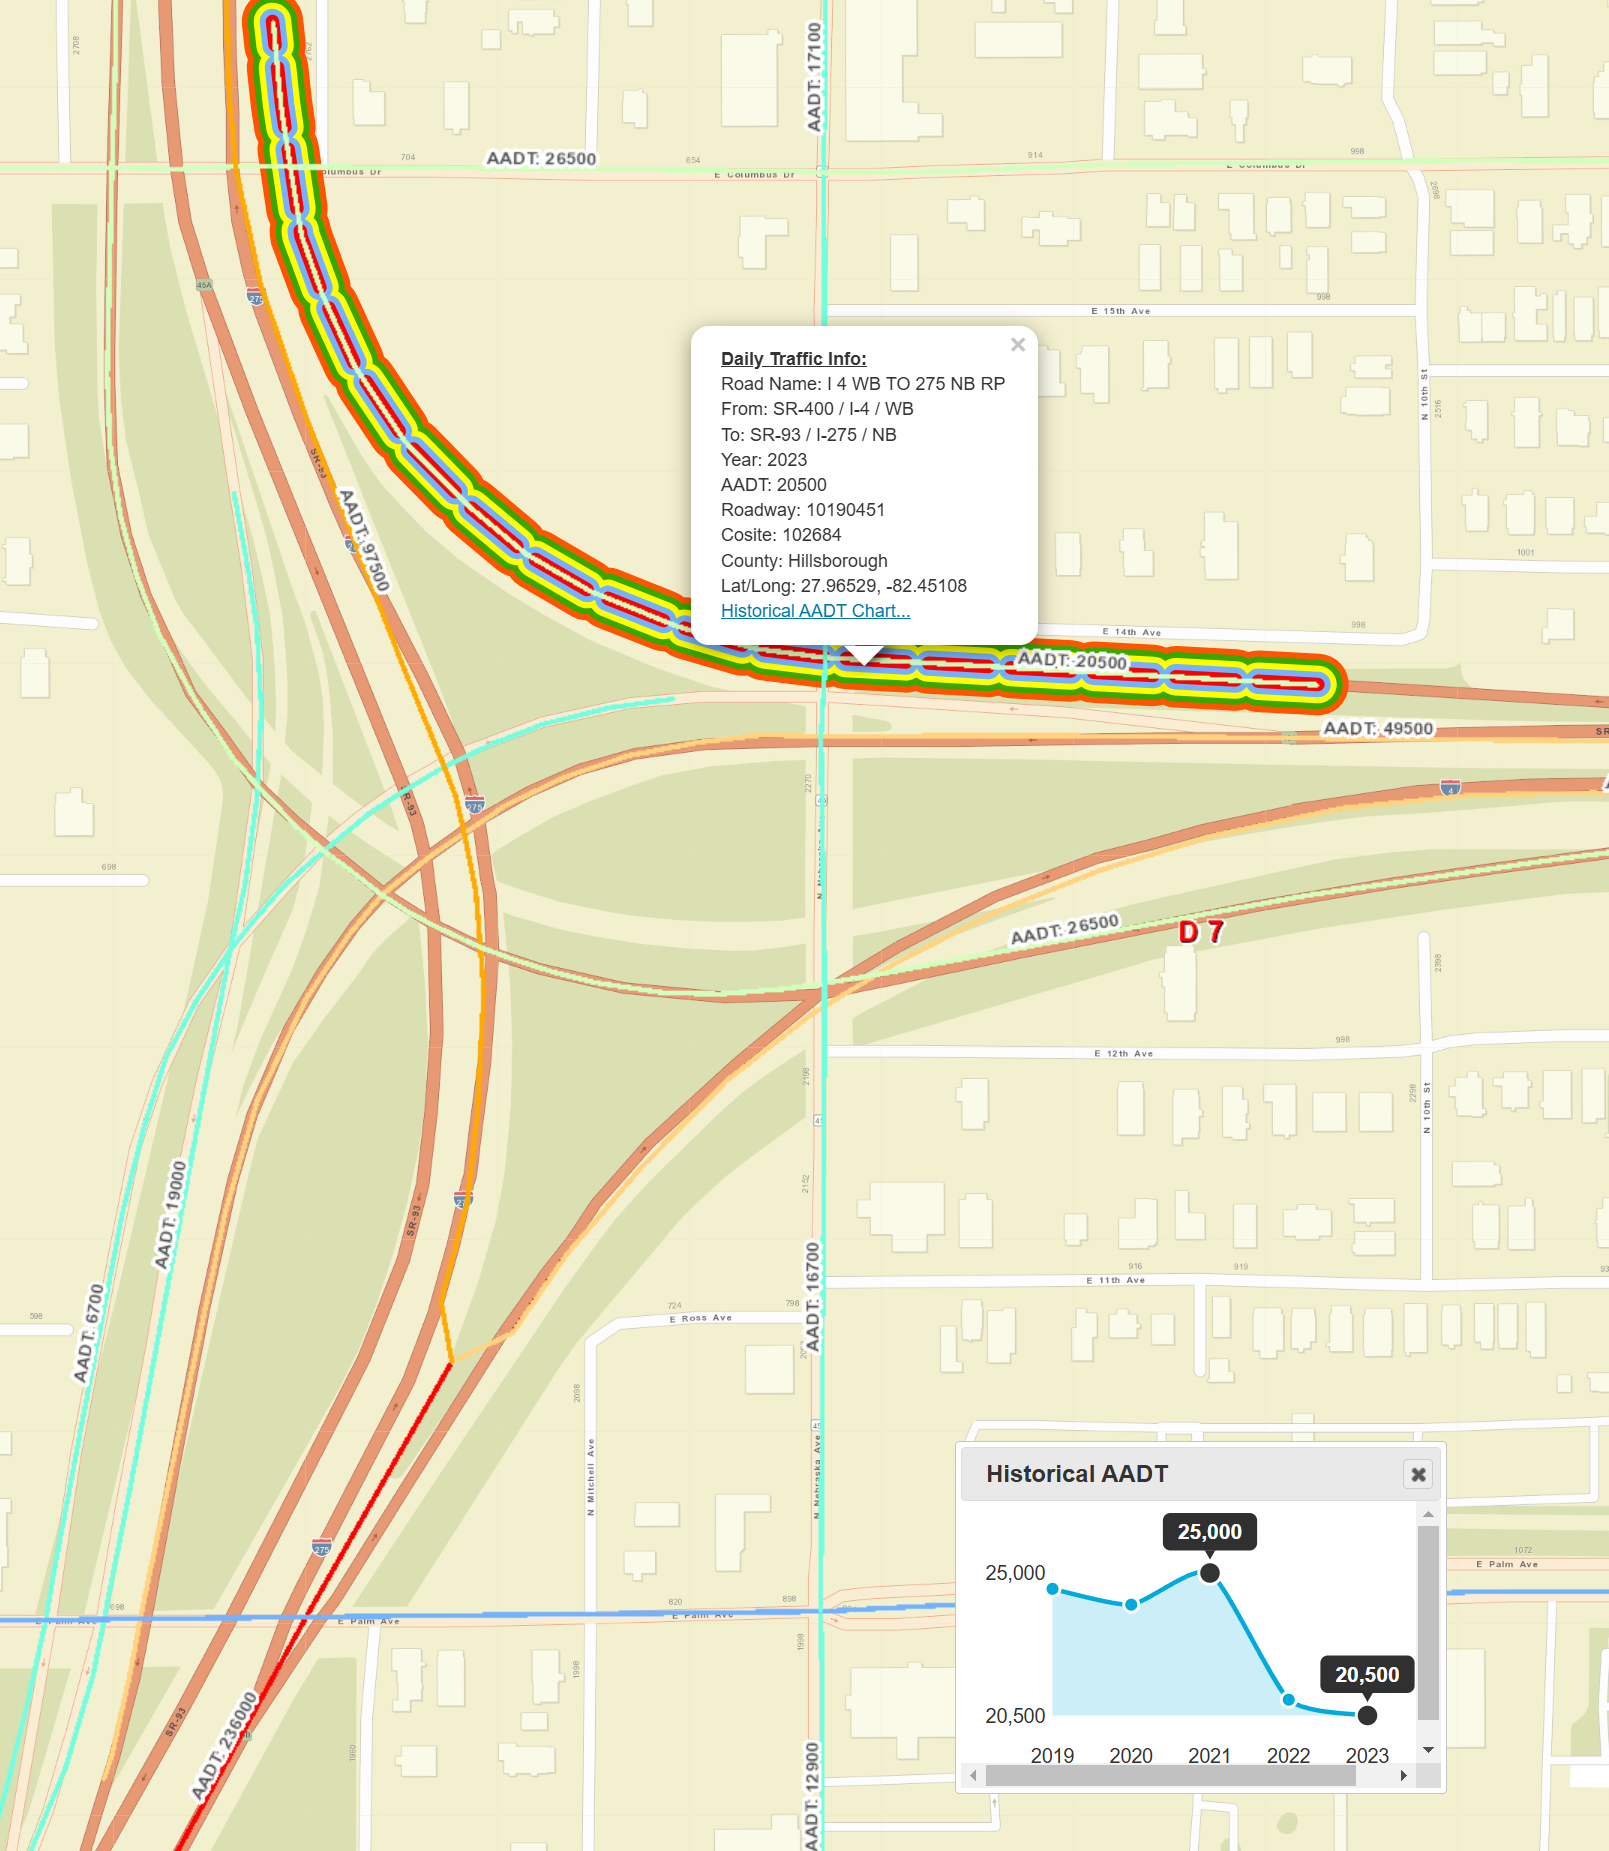
Below is a page we took from the EIS which approved in 1996 by the Federal Government. This is the downtown interchange portion of the TBNEXT showing traffic forecast in 2010 if nothing or no-build was accepted. We noted in magenta the total volumes of I-4 end of the interchange and in black noted what FDOT has currently in their traffic counts. In blue, we noted substantial projects, mainly new highways that link this interchange that have yet to be completed. This means, today, twenty-nine years later, with all these significant highways pouring traffic on I-275 and I-4, the traffic counts at this section is still lower than what was forecast.

Some traffic at this controversial interchange (some areas are elevated but only to prior years-not exceeding) has been trending down since 2021 as FDOT traffic counts verify below.
Other cases of local bad forecasting.
Suncoast Parkway:
Since then, according to an excellent summary from Tampa Times reporter Craig Pittman, that forecast was downgraded — twice. But the highway still didn’t meet the revised projections. In 2014, the road brought in just $22 million in tolls. Today the state of Florida heavily subsidizes the Suncoast Parkway with funds from other toll roads, Pittman reports.”
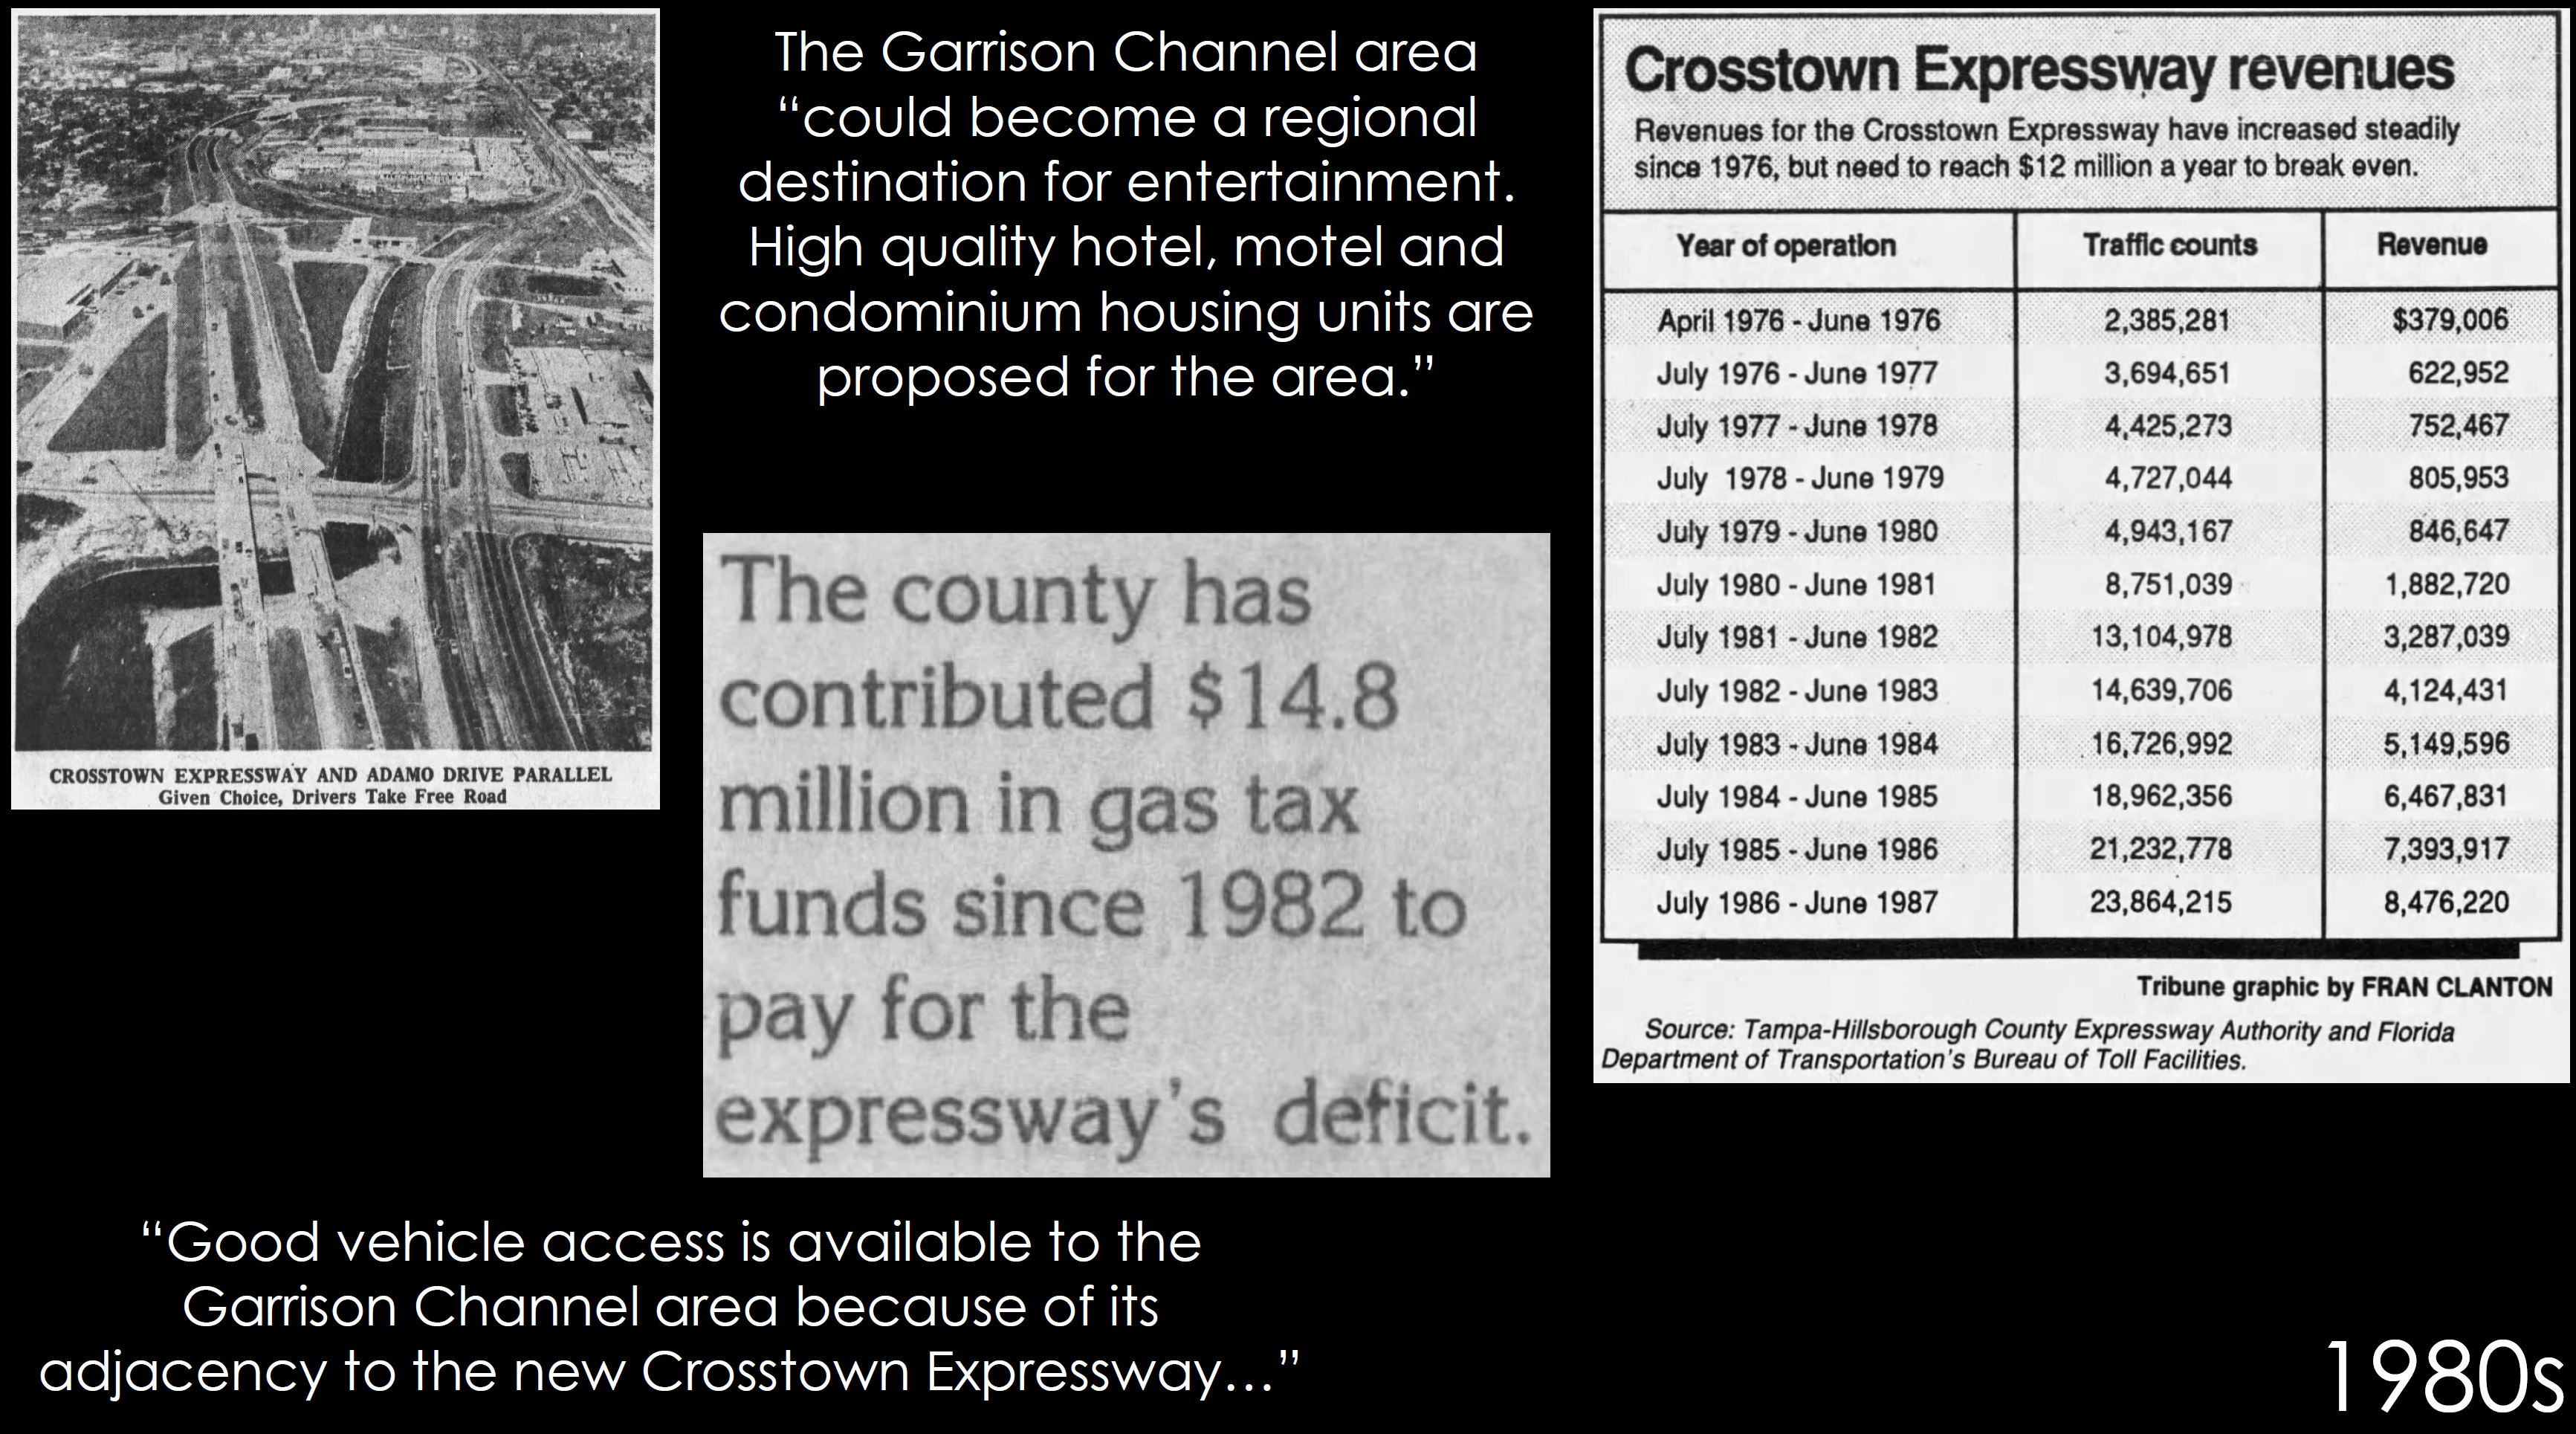
The Crosstown Expressway:
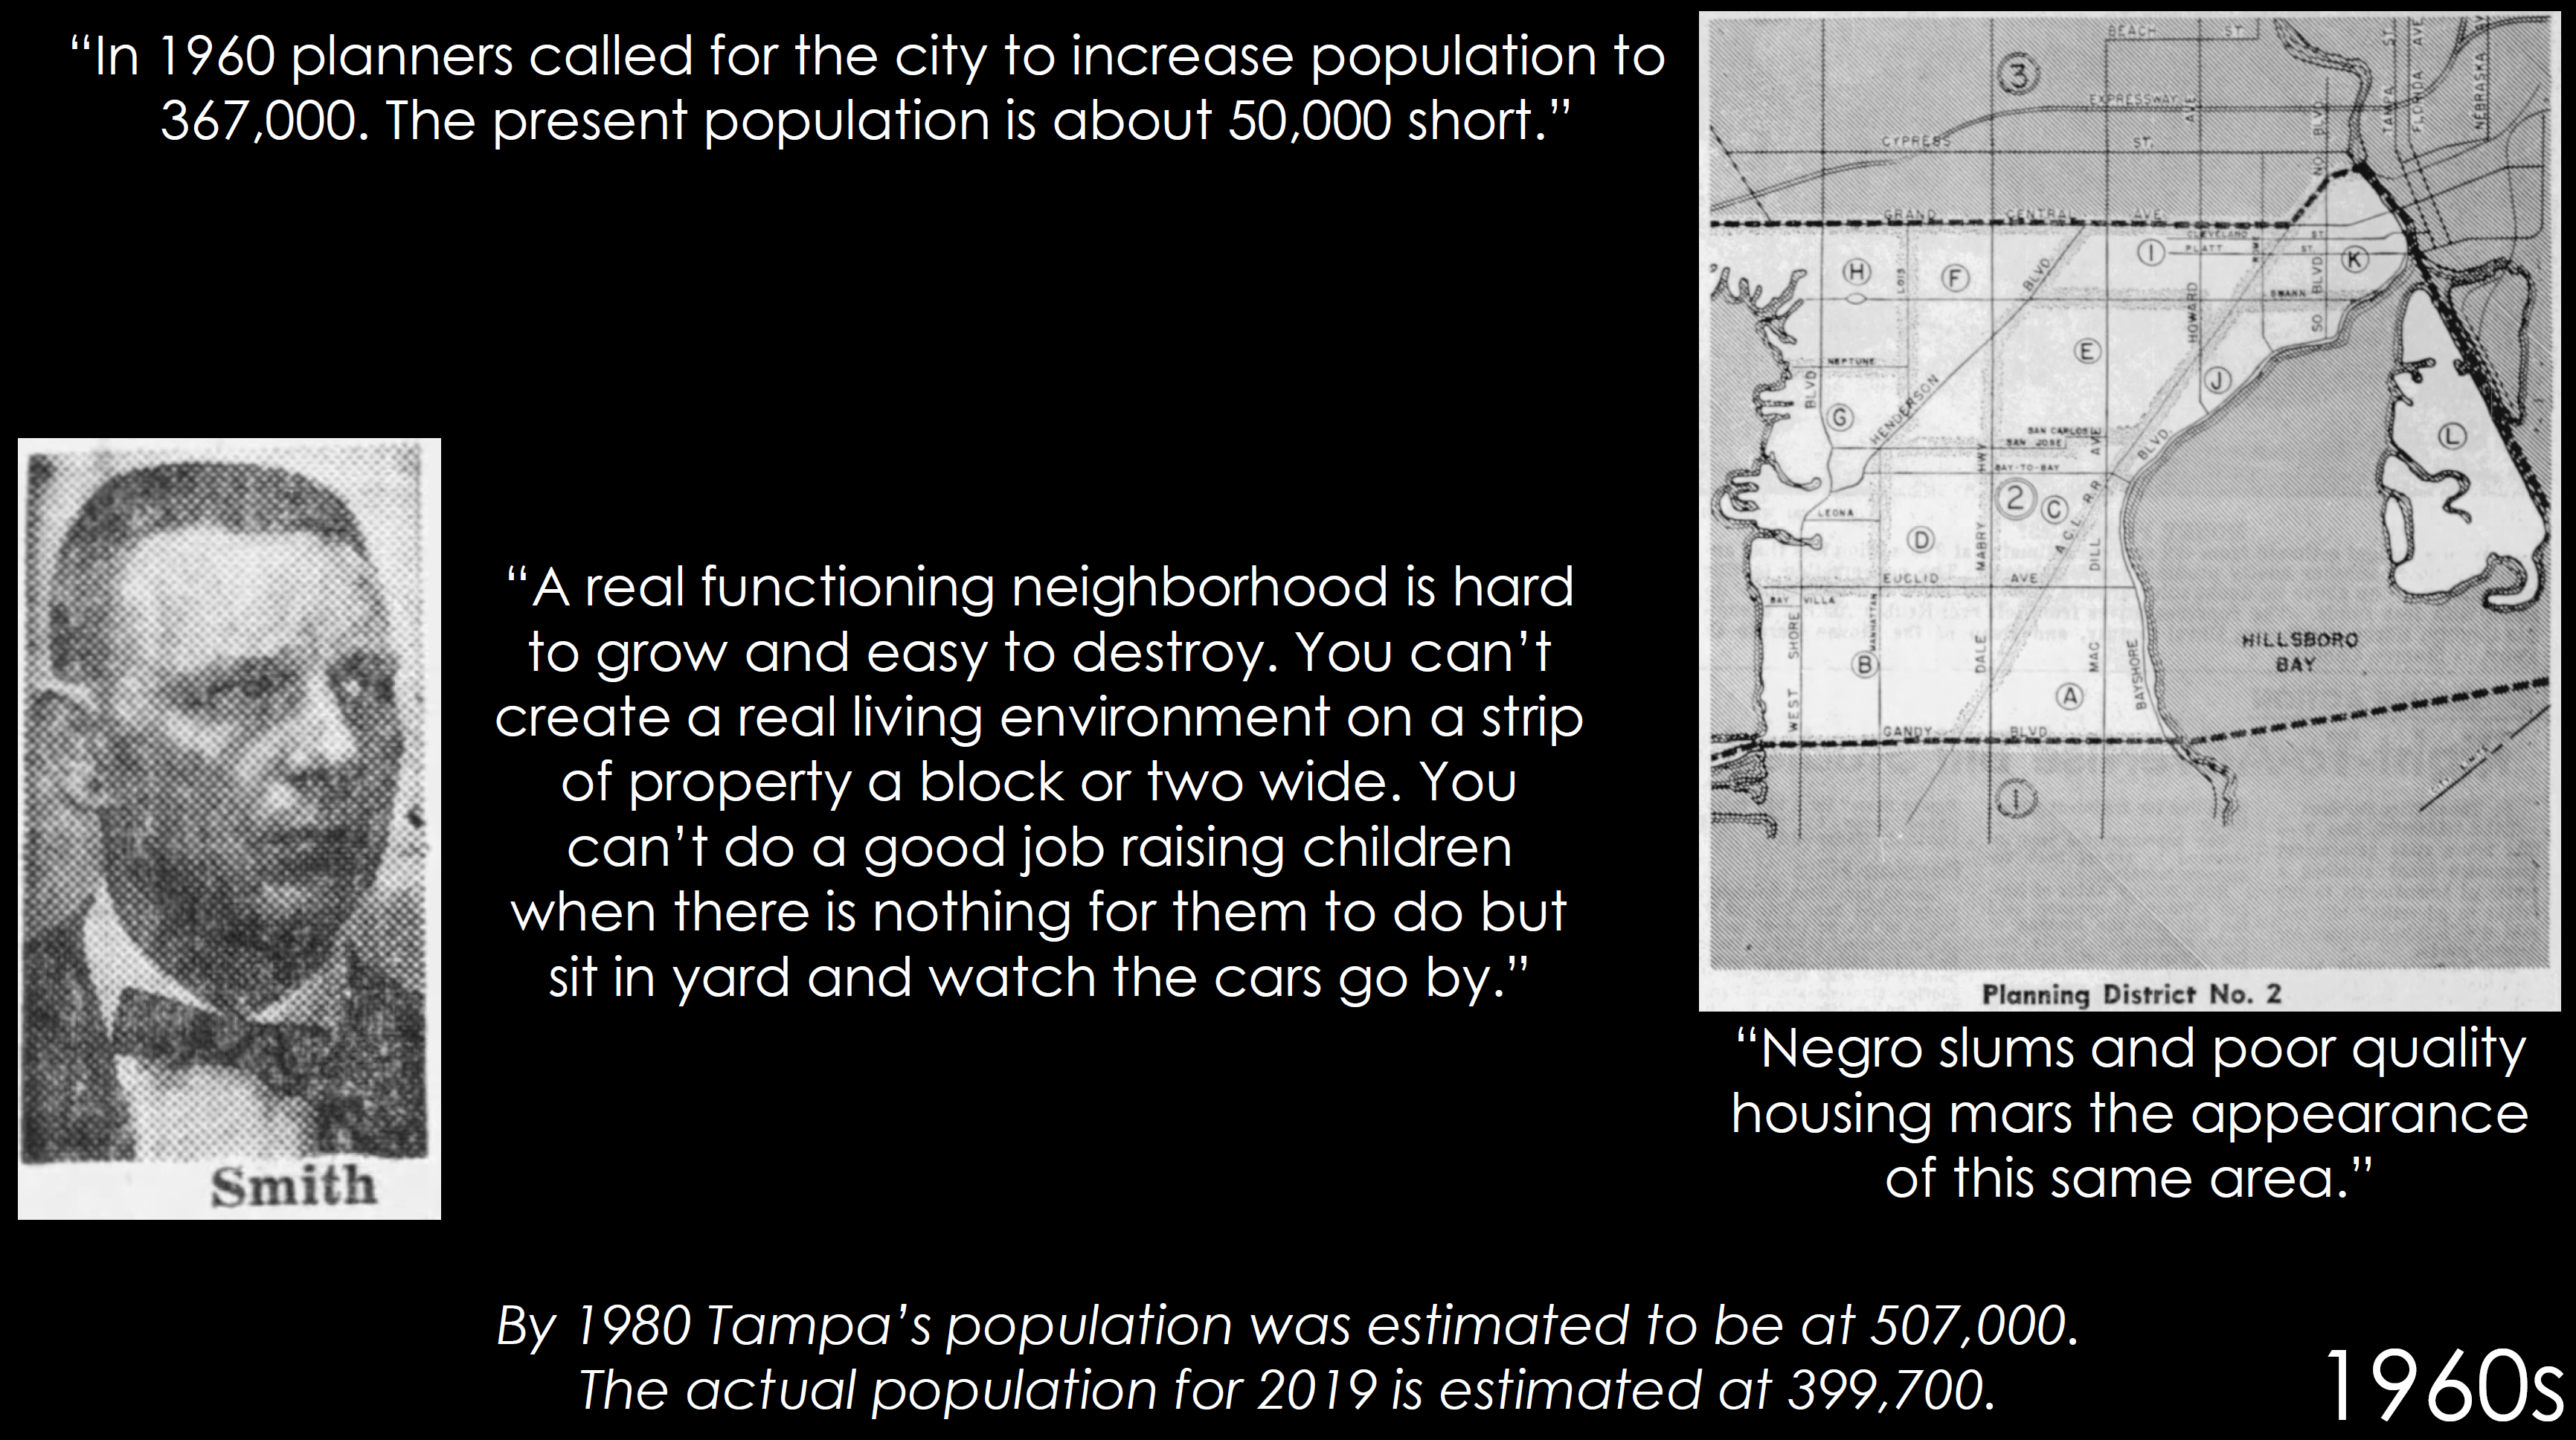
Below is a presentation we did for the TPO in regards with a tolled highway called the Crosstown. In the 1960s, planners thought by 1980 we would have over 500,000 people in Tampa. We just broke 400,000 in our population size forty five years later from 1980.
On another slide we noted the Crosstown Expressway hasn’t met toll revenue 11 years after it opened. In fact, it did not break even until the mid 90s.
We thank you for hanging in with us on this very long post. We hope you got the gist as to why highway building in the US and locally is out of control and science.
As you can tell, FDOT and all the agencies that work with them or under them are no different than WSDOT and MDOT. Florida, in particular, is a playground for the highway industry complex. Not only FDOT has displaced thousands of black and brown communities with racially driven traffic forecast models with their highway projects, Florida leads the nation with the most toll lanes. Recently it has been a challenge to get highly detailed information on public-private-partnership agreements on highway building as these are now proprietary contractual devices (in most instances), thus they can not be fully requested by the public. Though old, here is one of the best articles we discovered explaining how the next generation of toll lanes in Florida is business for the highway complex and engineering firms like HNTB, rather than a true public amenity to fairly manage congestion.

Leave a comment